
Research
Research Overview
My research asks how Earth’s climate, oceans, and water cycle changed during warm periods of deep time, and what those histories can tell us about future environmental change. Greenhouse worlds such as the Paleocene-Eocene Thermal Maximum, the Permian-Triassic transition, and the Triassic provide useful natural experiments, but they are difficult to read. The records are incomplete, their ages are uncertain, and the signals are often local rather than global.
I work on three linked problems. First, how can we build more reliable geological time scales? Second, how can scattered climate records be combined with Earth-system models to recover broader patterns? Third, how did water move between oceans, lakes, groundwater, and continents when large ice sheets were absent? To address these questions, my group develops computational tools, analyzes field and core records, and compares observations with model results. The aim is not simply to make older climate records more detailed, but to make them easier to test, compare, and use. I hope this work helps connect stratigraphy, paleoclimate, and quantitative methods, and offers a long-term perspective on climate change, sea level, ocean chemistry, and environmental thresholds.
Acycle, Cyclostratigraphy, And Triassic Time Scales
Geological records preserve time unevenly. A bed may represent years, centuries, or a much longer interval, and that uncertainty makes it hard to compare events from different places. Cyclostratigraphy uses repeated climate cycles recorded in sediments to estimate time, but the method needs transparent tests and reproducible tools.
Acycle as a practical tool for time-series analysis. I developed Acycle to make common cyclostratigraphic and paleoclimate time-series methods easier to apply and check. The software brings together spectral analysis, Monte Carlo tests, astronomical tuning tools, visualization, and teaching functions in one platform. In recent versions, my group has added methods for testing the significance of cycles, handling larger datasets, and comparing alternative time-scale interpretations. I see Acycle mainly as infrastructure: it helps researchers and students examine whether a pattern in a sedimentary record is likely to be meaningful, and it makes the steps of an analysis easier to repeat.
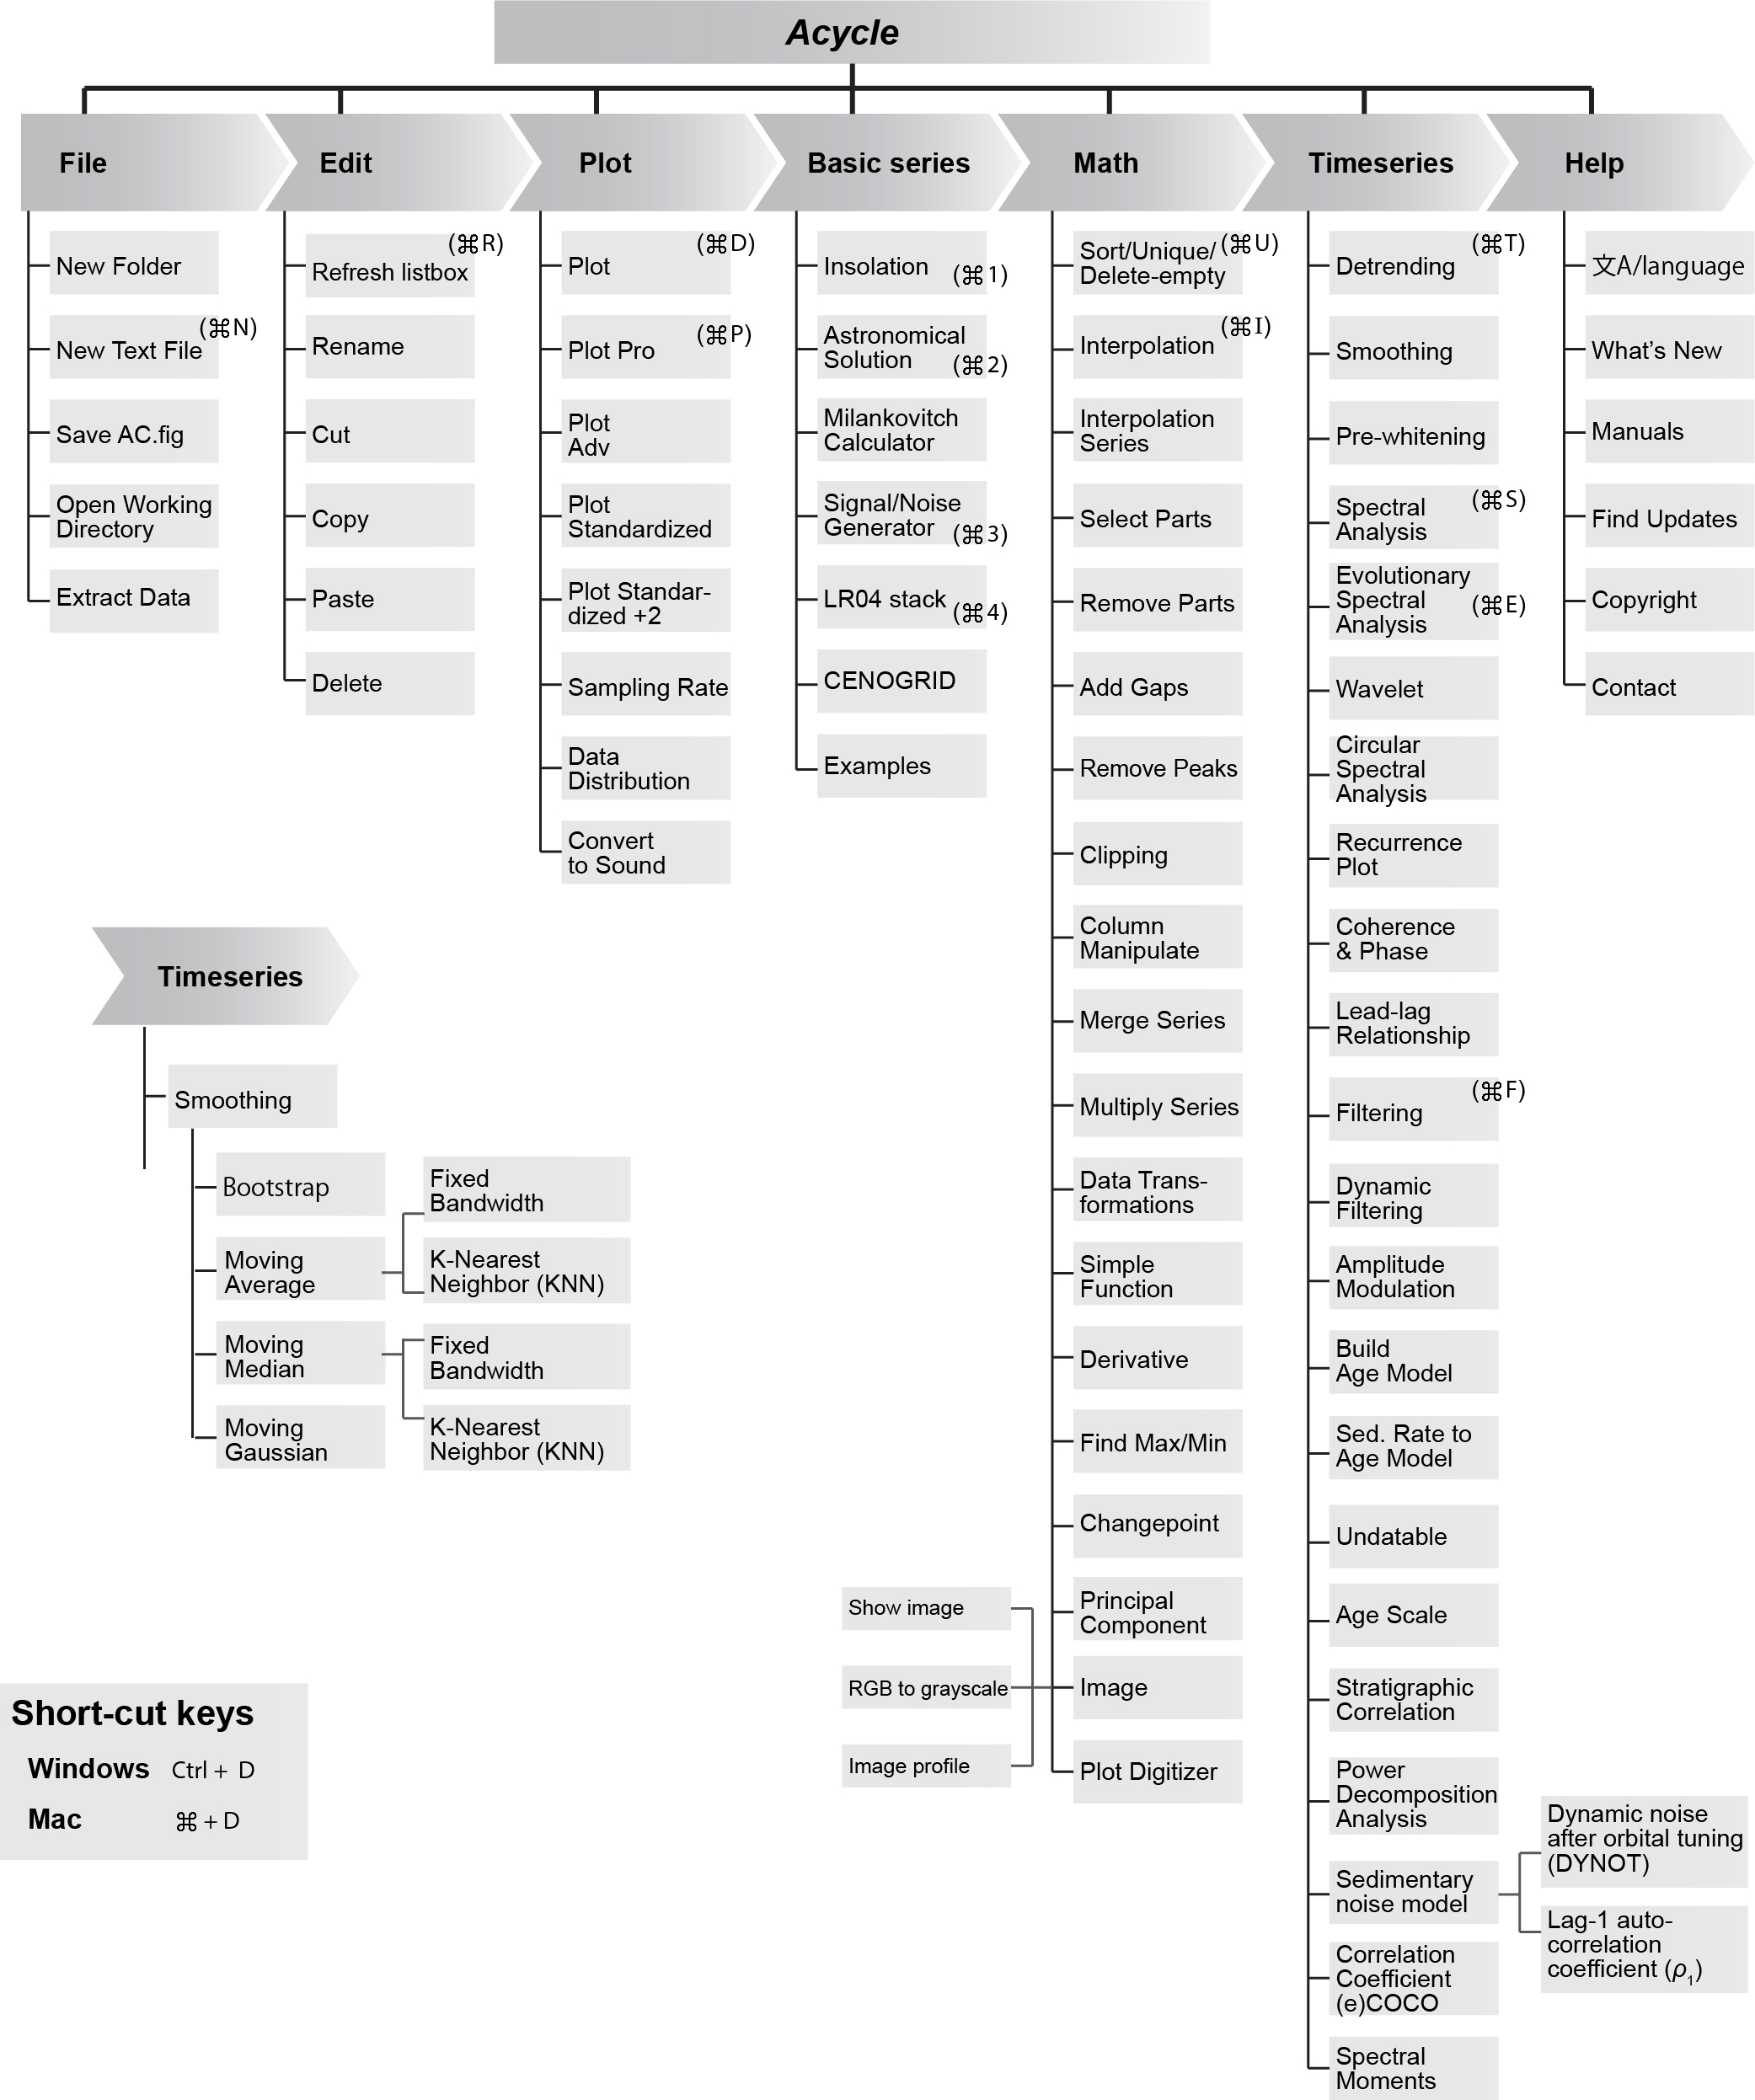
Figure 1. Overview of the Acycle software graphical user interface showing the main menus and available functions, including modules for file management, editing, plotting, generating basic series, mathematical operations, time series analysis, and help utilities.
Triassic time scales and stratigraphic calibration. A second part of this work applies these methods to the Triassic, a period that includes major environmental change and biological recovery after the end-Permian mass extinction. By combining cyclostratigraphy with magnetostratigraphy, radiometric ages, fossils, and geochemical records, we have worked to improve estimates of the durations and boundaries of key Triassic intervals. These time scales help researchers ask more precise questions about the pace of environmental change, the timing of ecological recovery, and links among climate, oceans, and life.
Timing And Spatial Patterns Of Major Carbon-Cycle Events
Some short intervals in Earth history show rapid warming, ocean acidification, and large changes in the carbon cycle. Two examples are the Paleocene-Eocene Thermal Maximum and the Permian-Triassic Boundary event. They are not perfect analogues for the present, but they are valuable because they record how the Earth system responded to large carbon releases.
Estimating rates and timing. Using astrochronology and statistical tuning, I have worked to place these events on clearer time scales. For the Permian-Triassic Boundary event, this approach helps estimate how long the main carbon-isotope shift lasted and how quickly carbon may have entered the ocean-atmosphere system. For the Paleocene-Eocene Thermal Maximum, the timing points to a possible link between orbital configuration and the onset of the event. These results are useful because rates matter: the same total environmental change can have very different effects depending on how quickly it occurs.
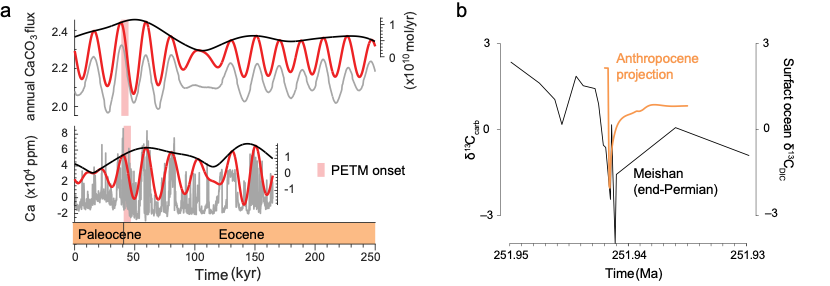
Figure 2. Timing carbon-cycle events. The panels compare model results and proxy records for the PETM and place the Permian-Triassic carbon-isotope shift in a broader perspective.
Reconstructing broader climate and ocean patterns. Many ancient climate records come from a limited number of places. To move beyond site-by-site comparison, I developed DeepDA, a data-assimilation framework that combines proxy records with Earth-system model output. Applied to the Paleocene-Eocene Thermal Maximum, this work helps estimate changes in atmospheric CO2, ocean pH, and carbonate saturation, while also showing that ocean acidification was spatially uneven. The value of this approach is that it makes the assumptions behind reconstructions more explicit and allows scattered evidence to be tested in a common framework.
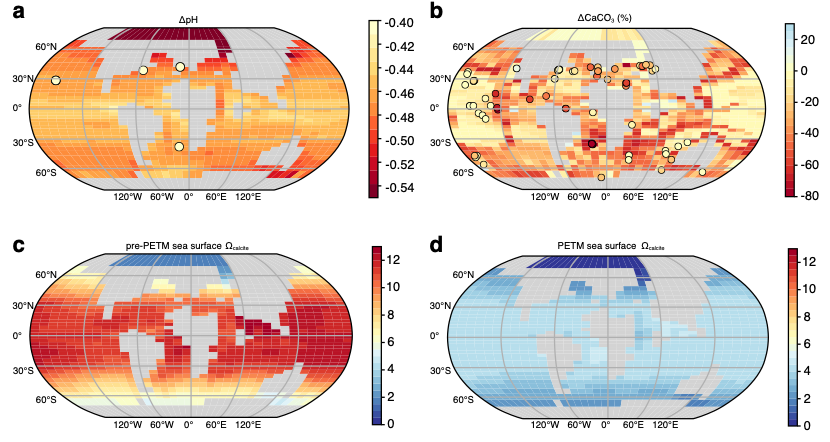
Figure 3. PETM data assimilation. Reconstructed changes in surface-ocean pH, seafloor carbonate content, and carbonate saturation before and during the event.
Sea Level, Lake Level, And The Role Of Continental Water
Warm periods without large continental ice sheets still show repeated sea-level and lake-level changes. This raises a basic question: if ice volume was not the main driver, where did the water move? My work explores whether changes in continental water storage, especially groundwater, may have contributed to these long-term fluctuations.
Reconstructing water-depth change. I proposed a sedimentary-noise approach to estimate relative changes in water depth from stratigraphic records. The idea is simple: the amount of background variability preserved in sediments can carry information about water depth and depositional setting. Implemented in Acycle and combined with geological observations, this method has been used to compare sea-level and lake-level changes across several greenhouse intervals. These comparisons suggest that long-period orbital forcing can pace regional hydrologic change, but that the response differs by latitude and basin setting.
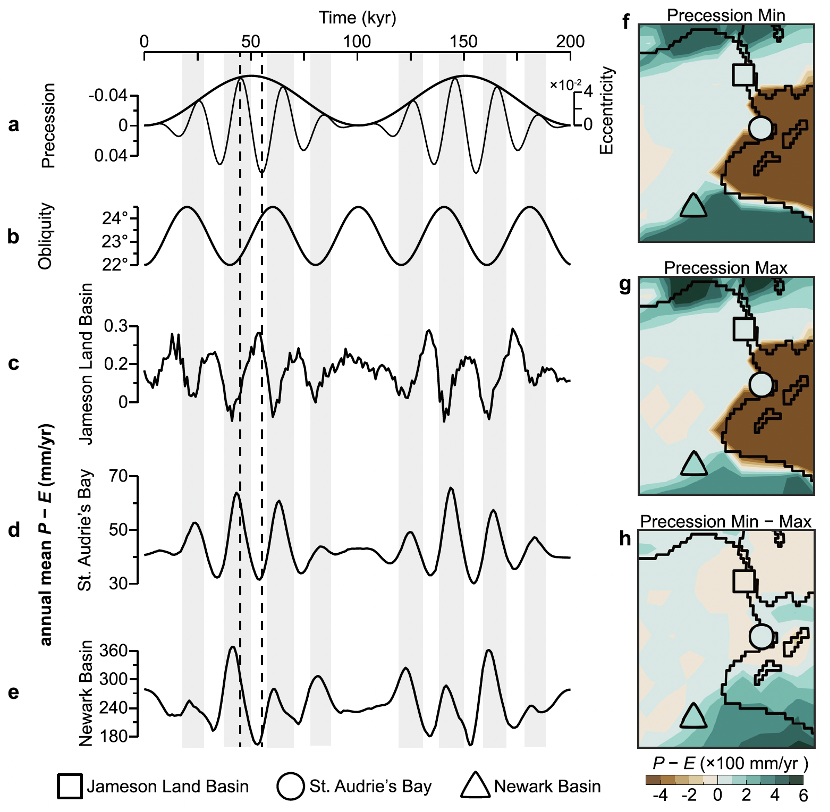
Figure 4. Hydrologic modeling at 210 Ma. The panels show how orbital forcing affects precipitation minus evaporation across selected basins and broader regions.
The Sponge Continent hypothesis. Building on these reconstructions, I proposed the Sponge Continent hypothesis as a testable way to think about groundwater in greenhouse climates. In this view, continental aquifers can store and release water over long timescales, partly buffering or amplifying sea-level change. The hypothesis does not replace other mechanisms; rather, it adds a component that may have been underestimated. Testing it requires better records, improved models, and careful comparison among basins. Its broader value is to bring groundwater into discussions of ancient sea level, climate, and ecosystem change.
Overall, my research aims to make deep-time climate records more useful: better dated, more quantitative, and more closely connected to mechanisms. I hope these efforts help provide a geological perspective on climate change while also giving students and collaborators practical tools for open, reproducible research.